
THESE PROJECTS DEMONSTRATE MY PROFICIENCY IN PYTHON, INCLUDING MY ABILITY TO WORK WITH COMPLEX DATA SETS.
THEY SHOWCASE MY SKILLS IN DATA EXPLORATION, STATISTICS, AND DATA VISUALIZATION, EMPLOYING NUMPY, SCIPY, PANDAS, SEABORN, AND MATPLOTLIB TO ACCOMPLISH THESE TASKS.

Credit Card Attrition
In Tableau, I utilized scatter plots and bar charts to analyze credit card attrition data and derive actionable insights. With scatter plots, I effectively visualized the differences between attrited and existing customers, highlighting distinct patterns and trends. Additionally, I employed bar charts to provide a comparative analysis of key metrics, allowing for a clear understanding of the factors contributing to customer churn. Through these visualizations, I aimed to provide stakeholders with valuable insights to identify potential churn factors and develop strategies to improve customer retention.
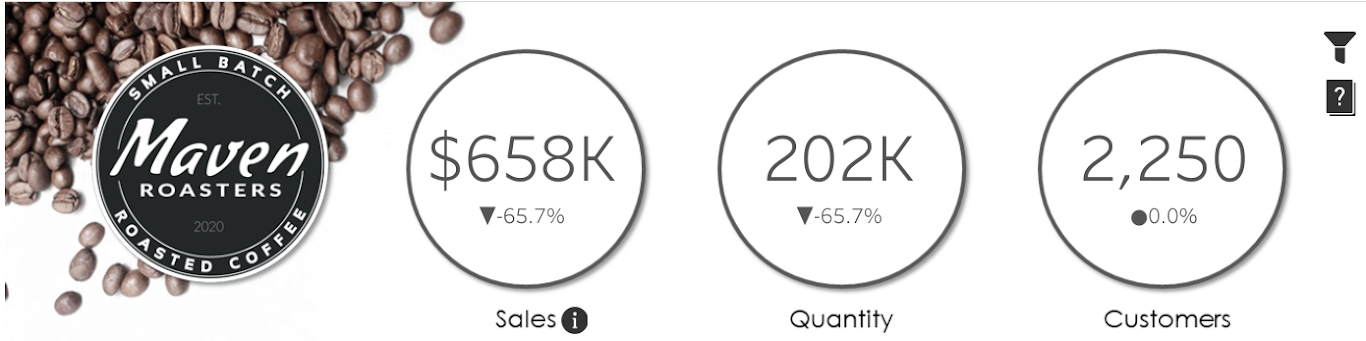
Maven Coffee Roaster:
In this project, I developed a comprehensive dashboard that effectively captured and presented key performance indicators (KPIs) related to sales, quantity sold, and the total number of customers. The dashboard offered a year-to-date overview along with a year-over-year comparison, utilizing shape indicators with percentage changes for quick insights. To enhance granularity, I incorporated graphs that allowed a detailed analysis of key metrics concerning various dimensions such as product groups, categories, specific products, stores, and weekdays. Moreover, I leveraged geospatial data to identify competitor radii from Maven Roadster, dynamically adjusting competitor counts based on store-specific radii. The dashboard seamlessly integrated all these elements, providing a comprehensive view of sales metrics and competitor relationships within a single interface