Maven Coffee
Overview
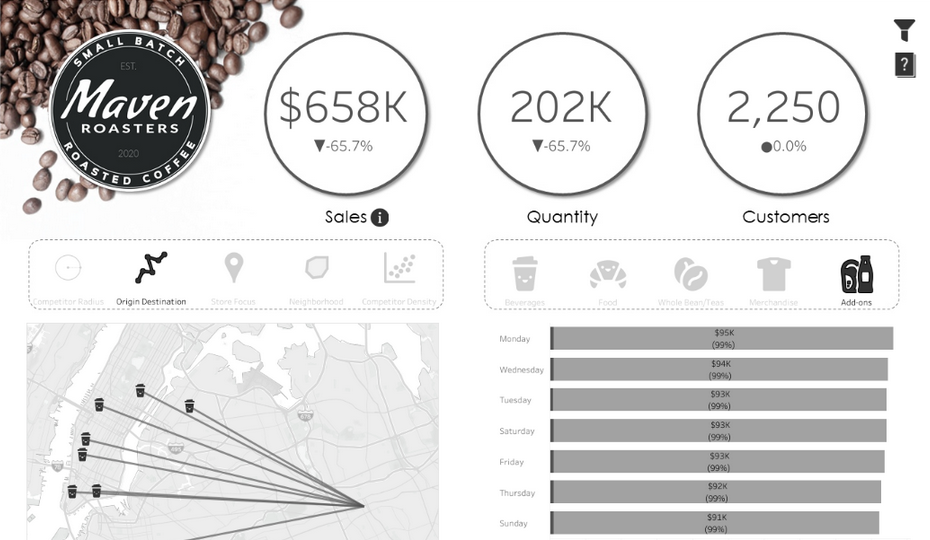
In this project, I undertook the development of a comprehensive dashboard aimed at capturing and presenting key performance indicators (KPIs) related to sales, quantity sold, and the total number of customers. The primary objective was to provide stakeholders with a clear and concise overview of sales metrics while facilitating deeper insights through detailed analysis. Leveraging advanced visualization techniques, the dashboard offered a dynamic interface that allowed for seamless navigation and interactive exploration of key metrics. By integrating geospatial data and competitor analysis, the dashboard provided valuable insights into competitor relationships and market dynamics, enhancing strategic decision-making processes.
Project Highlights
- Developed a dashboard showcasing KPIs related to sales, quantity sold, and total number of customers.
- Provided a year-to-date overview and year-over-year comparison for quick insights into sales trends.
- Incorporated shape indicators with percentage changes to visualize performance variations effectively.
- Utilized graphs to enable detailed analysis of sales metrics across various dimensions such as product groups, categories, specific products, stores, and weekdays.
- Integrated geospatial data to identify competitor radii from Maven Roadster, dynamically adjusting competitor counts based on store-specific radii.
- Seamlessly integrated all elements into a single interface, offering stakeholders a comprehensive view of sales metrics and competitor relationships.
Geospatial Mapping:
Geospatial mapping plays a crucial role in this project, allowing for the visualization and analysis of data in a geographical context. By leveraging Tableau's geospatial mapping capabilities, I explored various business scenarios and use cases, including customizing maps, ingesting geospatial data, and utilizing advanced spatial functions for analysis. The mapping workspace in Tableau provided a range of customization tools, including map layers, marks card, data pane fields, map options, map menu, and view toolbar, enabling the creation of dynamic and interactive geospatial visualizations.
Geospatial Use Cases:
Several common use cases were explored to visualize geospatial data effectively within Tableau, including heat maps, density maps, point distribution charts, radius maps, and standard maps such as proportional symbol maps and filled maps. These visualizations helped in analyzing spatial relationships and patterns within the data, providing valuable insights into geographical trends and variations.
Spatial Functions:
Spatial functions in Tableau were utilized for advanced analysis and combining spatial and non-spatial data. Functions such as MAKEPOINT, MAKELINE, DISTANCE, and BUFFER enabled the creation of spatial objects, generating line marks between points, measuring distances, and creating circular shapes with defined radii, facilitating detailed spatial analysis within the dashboard.
Custom Territories and Map Hierarchies:
Custom territories and map hierarchies were leveraged to dynamically select or consolidate geographic areas using traditional Tableau grouping functionality. This allowed for the visualization of custom territories and the creation of map hierarchies, enabling users to analyze spatial data at different levels of granularity and explore geographical relationships within the data.