Road Accident Project
Overview
The Road Accident Dashboard project aims to provide a comprehensive analysis of road accident data for the years 2021 and 2022. By leveraging Power BI functionalities, the dashboard will offer key insights into various aspects of road accidents, catering to the needs of stakeholders such as the Ministry of Transport, Road Transport Department, Police Force, Emergency Service Department, and Transport for London. The primary goal is to deliver actionable insights through primary and secondary Key Performance Indicators (KPIs), enabling informed decision-making and strategic planning to enhance road safety measures.
Project Requirements:
-
Primary Key Performance Indicators (KPIs)
- Total Casualties and Total Accident values for the Current Year with Year-over-Year (YOY) growth.
- Total Casualties by accident severity for the current year with YOY growth.
-
Secondary Key Performance Indicators (KPIs):
- Total casualties with respect to vehicle type for the current year.
- Monthly trend comparison of casualties for the current year and previous year.
- Casualties by road type for the current year.
- Current year casualties by area/location and by Day/Night.
- Total Casualties and Total Accidents by Location.
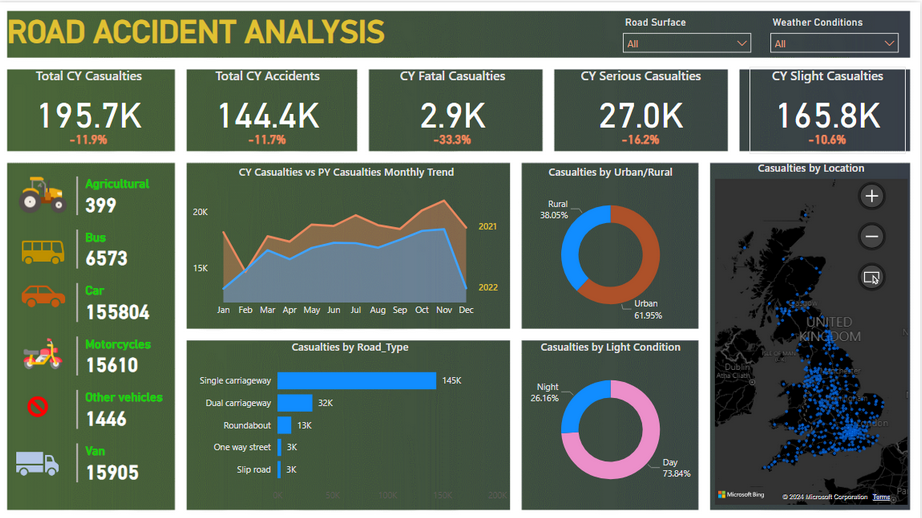
The dashboard included advanced KPIs, monthly trend analysis, and detailed breakdowns of casualties by accident severity, vehicle type, road type, area/location, and day/night conditions. The result is a dynamic and interactive dashboard that empowers users to gain valuable insights into road accident statistics.
GitHub Link
Findings
- Overall, there is a ~12% reduction in the number of casualties from 2022 to 2021, with the total number of casualties being 195.5k.
- This reduction also pertains to the total number of accidents, with the total number of fatal casualties reducing by 33%, notably during the winter months of 2022.
- December 2022 saw 13,000 casualties compared to 18,500 in December 2021.
- Single carriageways still have the most casualties with 145k, while dual carriageways have 32k.
- Urban areas account for 62% of casualties compared to rural areas.
- The highest number of casualties is attributed to cars.
Recommendations
- Expansion of Dual Carriageways: Considering the significant impact of road type on casualty numbers, exploring the expansion of dual carriageways where feasible could potentially reduce casualties. Single carriageways have notably higher casualty numbers (145k) compared to dual carriageways (32k). Additionally, implementing more one-way streets, where only 3k casualties were recorded, could contribute to safer road conditions.
- Road Surface Conditions and Warning Signs: Road surface conditions play a significant role in casualty numbers, particularly on single carriageways. Wet conditions resulted in 37k casualties, while dry conditions saw 97k casualties. Notably, snow and fog conditions resulted in 10.4k casualties. The presence of warning signs during adverse weather conditions seems to encourage cautious driving behavior. It's recommended to maintain warning signage even during dry conditions to promote safer driving practices. Analyzing road user behavior during varying road surface conditions can provide further insights into casualty reduction strategies.
- Analysis of Road User Behavior: Conducting an analysis of road user behavior under different road surface conditions can yield valuable insights into casualty prevention strategies. Understanding factors contributing to casualty reduction, especially during winter months, and assessing the effectiveness of safety measures in urban areas can inform targeted interventions aimed at reducing accidents and enhancing road safety overall.